1. Work as ML Engineers, extensively involved in ML models deployment.
2. Just want to read something new today!
We at Simpl have a host of models - both batch and realtime, which cater to multiple usecases in Antifraud, Underwriting & other verticals.
This article specifically delves into the deployment of Realtime Inference Models and shares our journey toward improving system performance.
How things have been?
Our data scientists spend significant effort in data exploration, model architecture and hyperparameter tuning to develop a model. These models are generally created using Tensorflow or PyTorch. We'll be using Tensorflow for illustration.
Once we get the models as pickle or .h5 files, we create a Python service which is then responsible for:
- Accepting inference requests via HTTP
- Extracting features from raw API input data.
- Running the model inference to generate predictions.
- Executing peripheral tasks, such as event publishing, in background threads.
Depending on the complexity of the model and hops in the feature extraction process, the service can give a certain throughput.
These models wrapped in a Python Service are fondly called as MaaS - Model as a Service!
To make further reading and illustration easier lets consider a fraud detection Model as a Service - Selmore MaaS. This model detects fraudulent transaction patterns to flag risky users. Traffic directly corresponds to the time when users are most active on Simpl Network.
We use FastAPI python Framework along with Uvicorn workers and Gunicorn worker manager to run our python application. This service is deployed in an ECS cluster of m6a.xlarge machines(16 GB memory, 4 CPUs).
Moreover we have setup autoscaling on AWS ECS to scale the task count as well as EC2 machines based on the amount of traffic served by each task. Each task can serve requests at a certain throughput.
Tasks scale proportionally to the traffic
Establishing Baseline
Before we go in guns blazing, it is important to establish a baseline in terms of:
- Latency profile - average & tail latencies
- Resource Usage
- Memory & CPU Usage - maximum & minimum
- Task counts
Doing above analysis on our Selmore MaaS yielded below curves:
🐢 Latency Profile
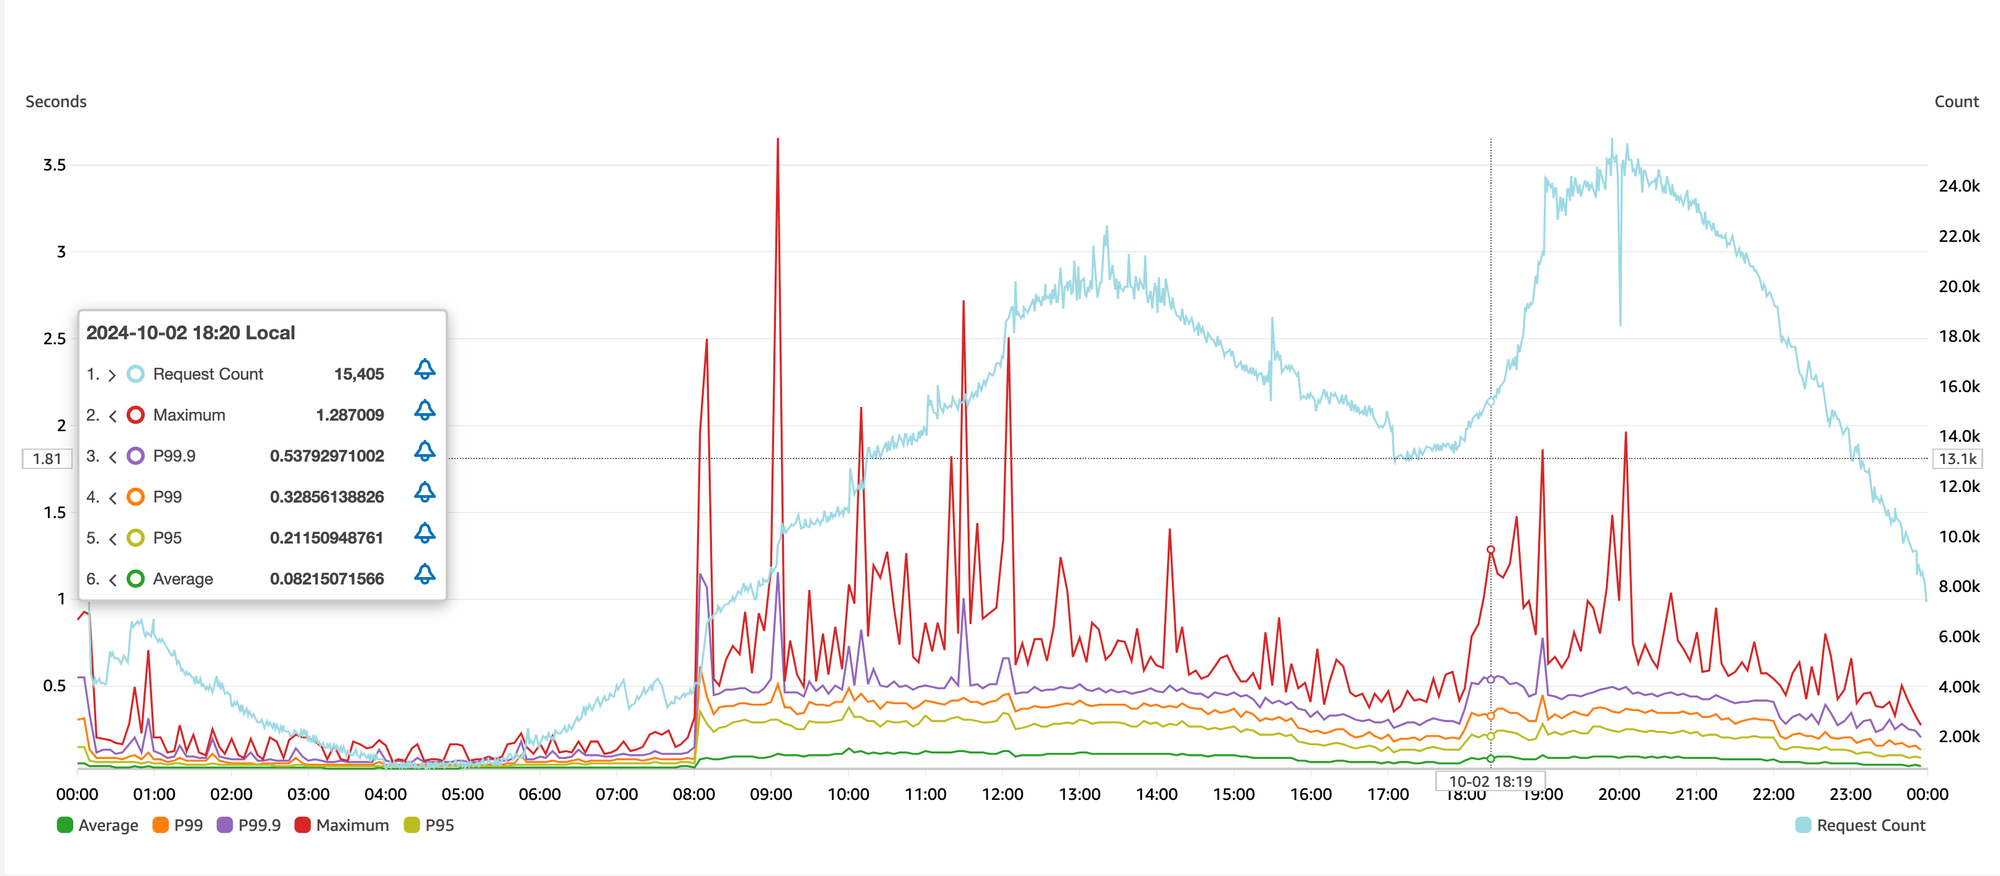
Few pointers from above graph:
- During off-peak hours, i.e. between midnight and morning hours, the latencies are within acceptable limits.
- As the traffic increases over the day, the response time increases as well, regardless of horizontal scaling. Tail latencies(P99, P99.9, Maximum) are hurt the most.
- The stark contrast between off-peak and peak performance highlights inconsistencies in the system's scalability and stability.
The response profile is far from ideal, as it should remain relatively stable regardless of traffic volume.
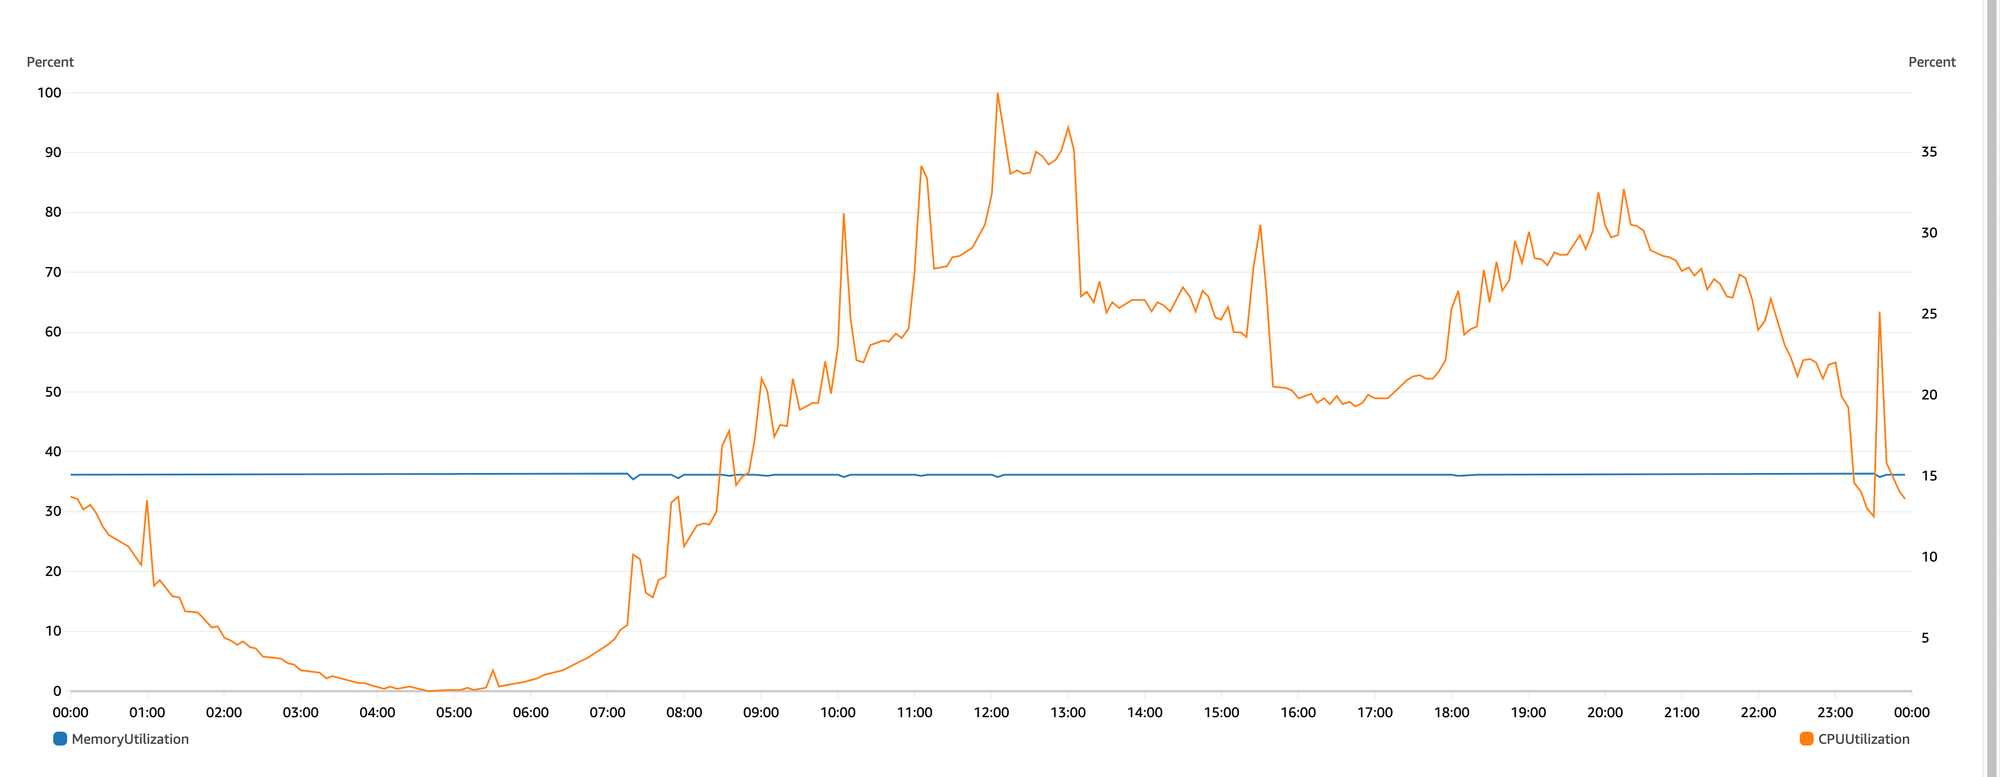
🤖 Memory & CPU Profile
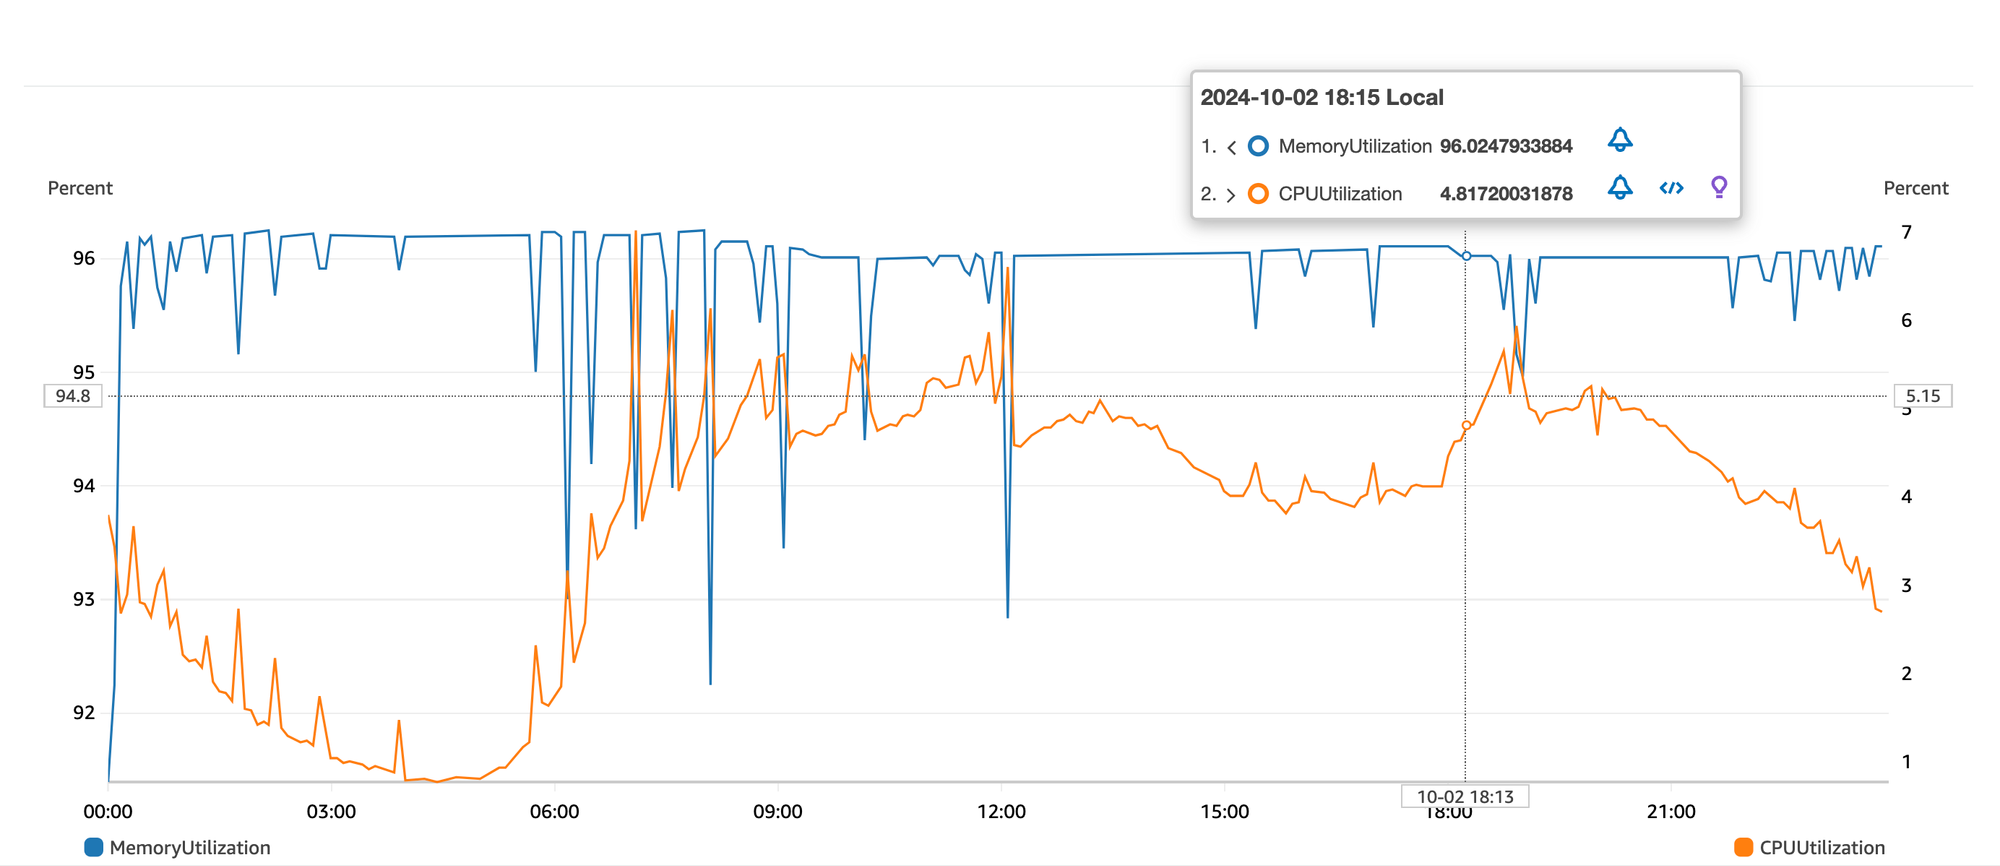
From the above graph:
- Memory remains relatively stable at around 97%. Each task is configured with 1200 MB reserved memory.
- CPU is criminally underutilized. But the caveat is that this is a shared CPU on an EC2 machine used by different microservices with varying CPU requirements. But a peak 7 percent is substandard resource utilisation nonetheless.
📦 Task Counts
In order to serve a traffic of 30M requests a day, we were running an average of 80 tasks. The maximum and minimum can range between 30 to 200 tasks depending on the traffic.
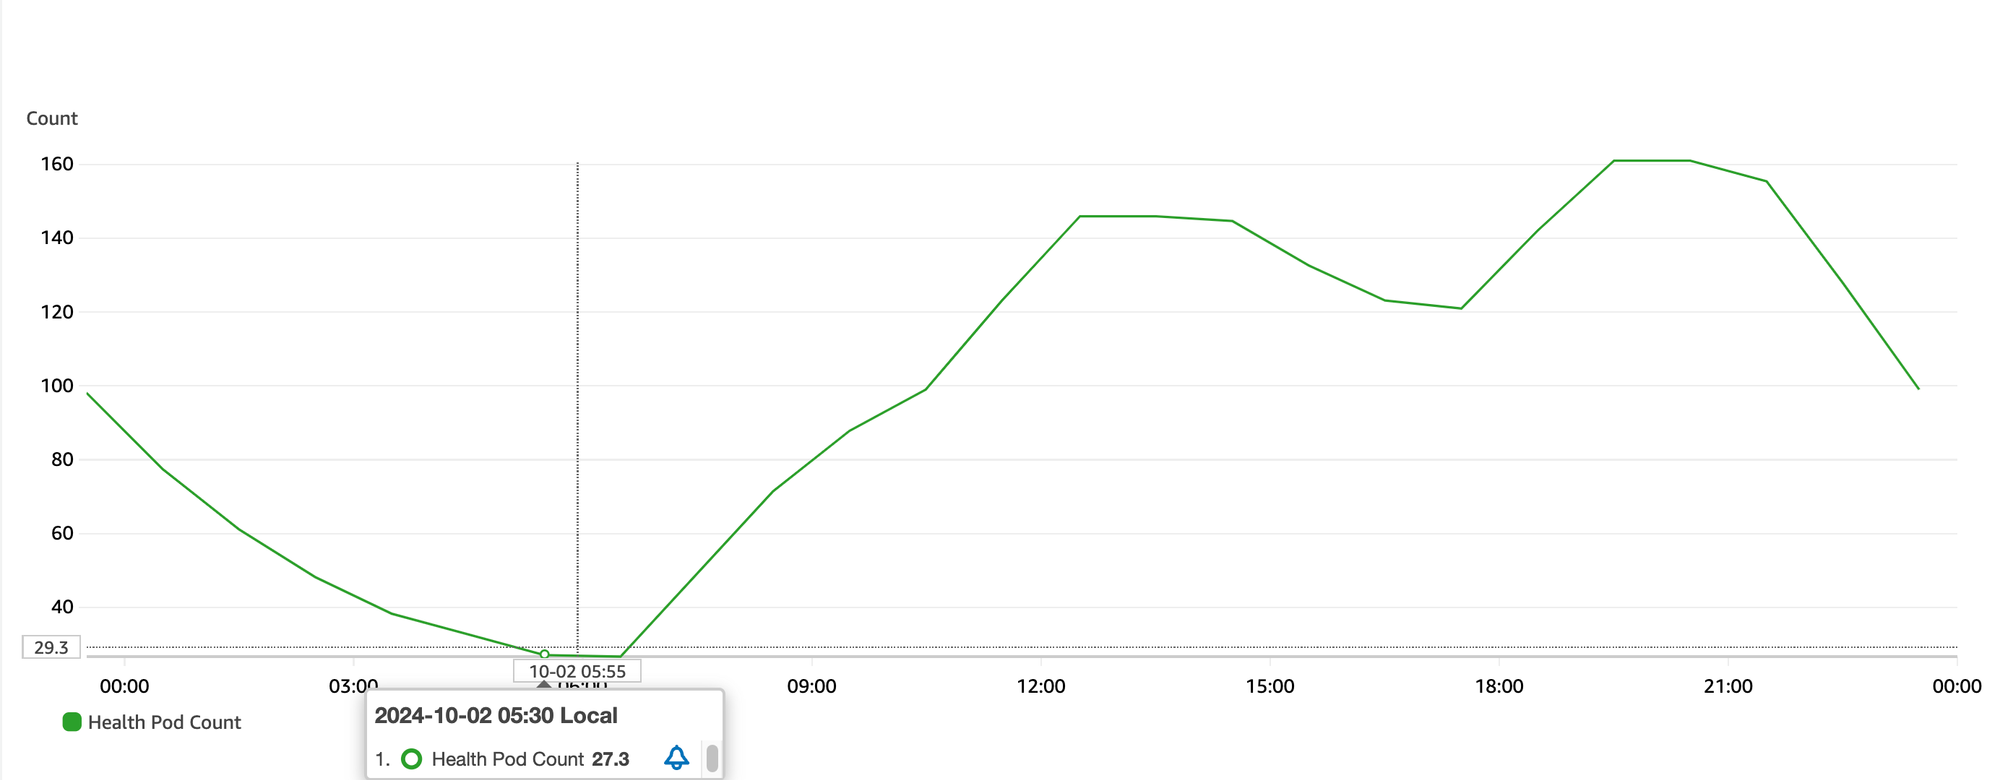
With 80 tasks, each with 1200 MB configured memory, we are using on average 96GB of EC2 memory.
Summarizing the problems so far:
- Irregular latency profiles which degrade with increase in traffic.
- High memory usage
- Poor CPU utilization
- Too many tasks required to serve just 30M traffic.
While points 2 & 4 can be attributed to some extent to the choice of our tech stack (Python!), it is beyond doubt that we are running a scooter on a Ferrari budget. This problem proliferates when you have a fleet of MaaS'.
🚫 Identifying Bottlenecks
Let's deep dive into the problems.
Why the awful latency profile?
Before we can understand the reason for the bad latency profile, it is important to understand how FastAPI processes a request in concurrent context(using async-await).
The event loop is like a chef who accepts orders(requests), processes them until he encounters a time consuming activity like boiling, baking, etc (akin to disk or network I/O). He then starts cooking another order or picks up another activity earmarked for later in the past, equivalent to picking up the task delegated to a thread for some previous request.
This allows for concurrent handling of requests resulting in better utilization of resources.
But what happens if your code lacks await-able code routine? In such scenario the Event loop is forced to process a request end to end, one request at a time!
Assuming, each request takes on average 15ms to process, projected RPS with 3 Gunicorn workers:
| Heading | Value | |
|---|---|---|
| Time to process 1 Request | 15ms | |
| Number of requests processed in 1 sec per worker | 1000/15 ~ 66 RPS | |
| Total requests processed by 3 workers | 66 * 3 = 198 RPS |
This number (198RPS) is really close to the throughput we got in load testing of the application. Each request was getting served by one of three workers synchronously.

When the traffic is high, the requests start piling up in the buffer, hurting all measurable latency stats.
To summarize the issue here, the application is inadequately using the available CPU cores. The requests remain in wait state until the event loop becomes available.Why the High Memory?
It is no secret that Python is a more resource hungry language compared to compiled languages like Java and Golang. However lack of machine learning library ecosystem in other languages forces us to use Python.
That said, it is however not justifiable to attribute the high memory usage to just the choice of language.
Memory profiling is an important technique to understand memory usage of an application. Python has libraries like memory_profiler, memray are some good libraries. Below memory profile was created using the memray profiler.
Icicle Graph for a singe request execution in application
Observing the graph in video above:

A big chunk of memory is occupied by Tensorflow dependencies and model. Considering we have 3 workers (3 child processes) each loading the model and corresponding Tensorflow dependencies, it is safe to say that we have the culprit for high memory usage. As we keep on increasing the worker count, the memory increases proportionally.
There is a way to share the model and dependencies across the processes using something called preloading in Gunicorn.
preload_app=True in the Gunicorn configuration, the master process initializes the application once, and the worker processes inherit this preloaded state. This approach reduces memory usage by sharing read-only parts of the application between workers and speeds up worker startup times. As the worker continues serving the requests, it can create new objects using copy-on-write (COW) as and when required. Using preloading we aren't exactly sharing the model but only the immutable components which help us load the model in the memory.Shortfalls in this approach:
- While the container now starts with just 400 MB memory requirement, the memory pattern becomes highly unpredictable and increases over time as more and more COW objects are created.
- Tensorflow Graph does not work well in shared memory environment. Various Github issues (#13116, #61298) raise questions on thread-safety of Tensorflow Python bindings.
The remaining two observations - low CPU usage & High task count requirements have similar explanation as above:
- Owing to the less complexity of the model (compared to LLMs/CNNs), synchronous processing of the requests is leaving the CPU underutilized.
- Low throughput per task and over-provisioning in an effort to keep the latency under control leads to more task requirement.
Tensorflow Serving for the rescue
TensorFlow Serving is a flexible, high-performance system designed for serving machine learning models in production environments. It supports deploying TensorFlow models and can extend to other types of models, offering a robust framework for inference at scale. TensorFlow Serving allows seamless model updates without downtime by using versioned model management, enabling dynamic loading, unloading, and serving multiple models simultaneously.
It provides APIs for gRPC and REST to handle prediction requests efficiently. Built for speed and reliability, TensorFlow Serving is optimized for low-latency and high-throughput scenarios, making it ideal for deploying machine learning systems in real-world applications.
Tf-Serving has a very convenient docker image that you can spin up after providing the required configuration files & Model binaries.
docker run -d -p 8501:8501 --name=selmore-serving \
  --mount type=bind,source=$(pwd)/models/,target=/models \
  -t tensorflow-serving --model_config_file=/models/models.config
That's it! The container is now ready to accept feature vectors as input and respond with the predictions - just as you would do in case of invoking a model.predict() function.
Wonderful things happen when you separate the inference engine from your python application.
- Unlike python Tensorflow bindings, Tf-Serving uses core C++ Tensorflow for inference which is both faster and thread-safe. So Tf-Serving, albeit loading the model once is able to provide astronomical throughput(1600 RPS for just model inference).
- Since model inference is now an I/O for the python fastAPI application, the event loop is able to serve requests concurrently improving both the Latency profile & reducing task counts required to serve the same number of requests.
- Tensorflow dependencies are not loaded in the fastAPI app and only once by the Tf-Serving process. This massively reduces the memory footprint.
Ideal Approach to using Tensorflow-Serving
Here Tf-Serving container is deployed as its own independent application. All the other components like Feature Extraction, Post-processing, Event Publishing, etc are handled by upstream.
The upstream service as well as the Tf-Serving task are deployed separately. You can also deploy the Tf-Serving task on a CPU optimized machine for better performance. Both the components can be scaled independently.
Using Anti-Pattern - One Container, two apps
In order to avoid too much re-write, and inter-task communication between fastAPI app & Tf-Serving tasks, we decided to deploy Tf-Serving as a separate process inside the same API container. The API process now communicates with Tf-Serving over localhost.
#!/bin/bash

set -e

cd $APP_HOME
nohup tensorflow_model_server --rest_api_port=8501 --enable_model_warmup --model_config_file=$MODEL_CONFIG_FILE > server.log 2>&1 &

# Add a delay
sleep 5
gunicorn app:app -k uvicorn.workers.UvicornWorker --config ./gunicorn_config.py
run-server.sh invoked in Dockerfile
Result
The result exceeded our expectations. There were drastic improvements across the board.
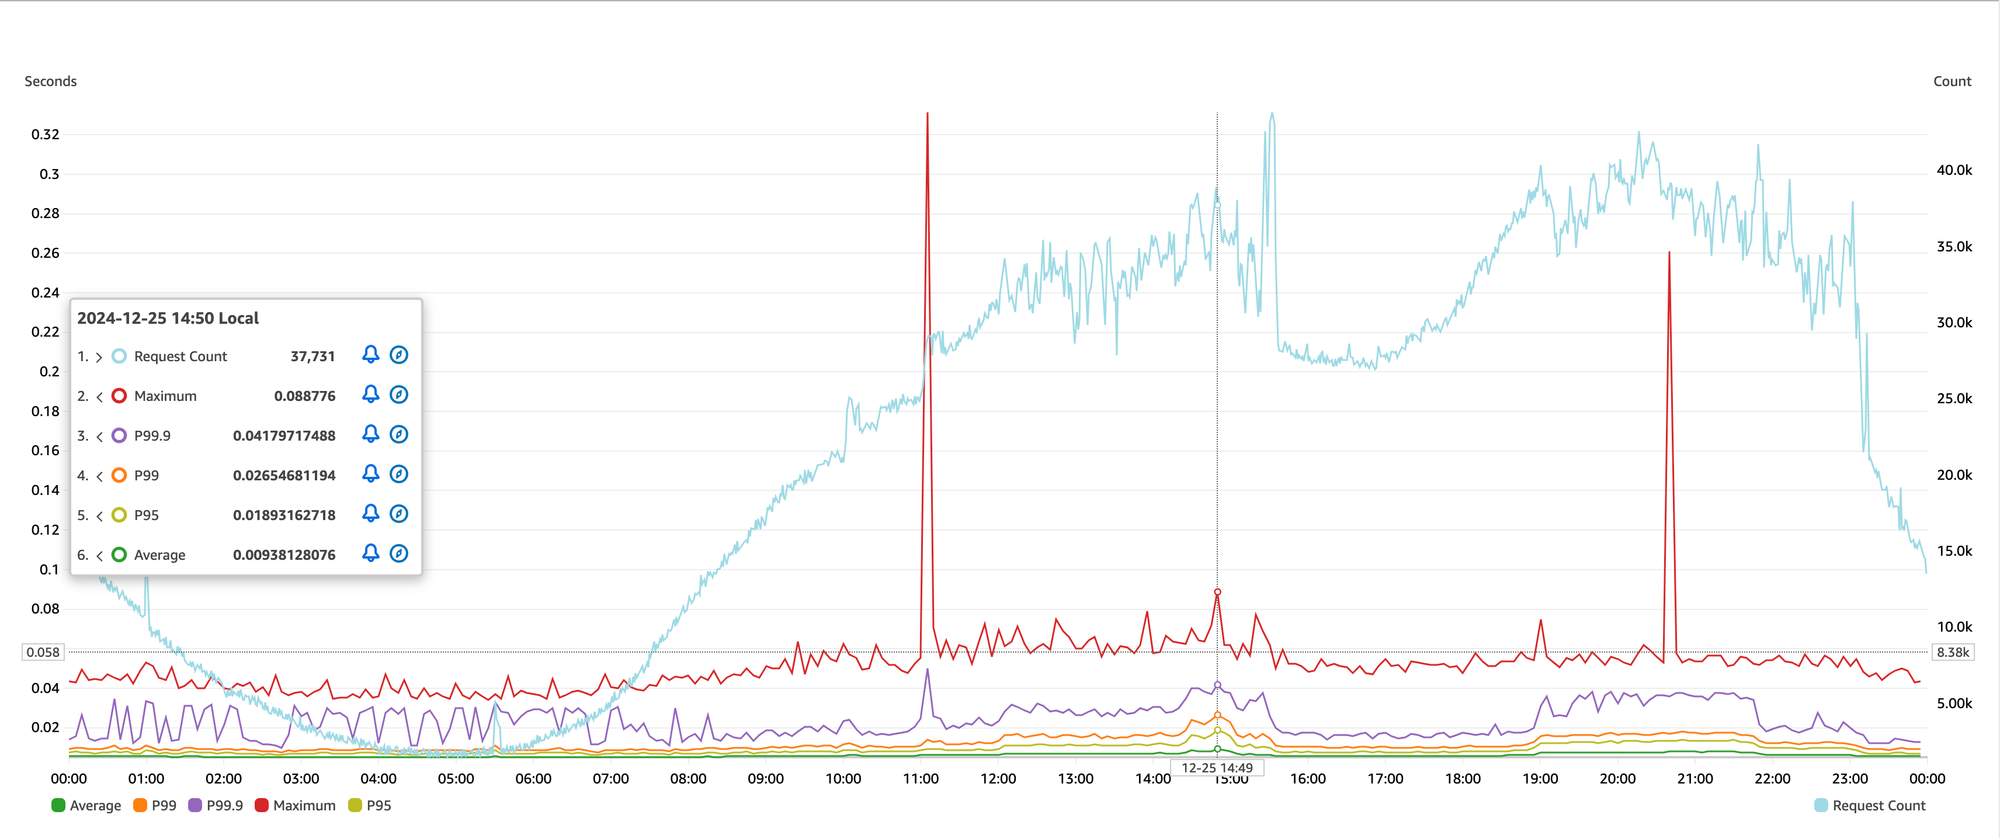
| Metric | Old | New | Change |
|---|---|---|---|
| Average | 40 ms | 6 ms | ⬇️ 85% |
| P99 | 150 ms | 11 ms | ⬇️ 92% |
| Max | 1 s | 90ms | ⬇️ 90% |
| Memory Requirement | 1200MB | 600MB | ⬇️ 50% |
| Throughput | 198RPS | 900RPS | ⬆️ 450% |
| Task Counts(Avg) | 80 | 15 | ⬇️ 80% |
*Above numbers are approximations and don't necessarily correlate to the graph above. Also the new stack runs on a better machine so it's not exactly an apple to apple comparison but close enough!
At present, the service scales to just north of 20 tasks when we have high traffic, way down from 200 in the past. An additional benefit is that, we can now use CPU optimized EC2 machines(c6a.2xlarge) which further improves performance without emptying our purse. Our overall cost to run this service reduced by 63%.
Further Reading
Interested souls can read Tensorflow docs to understand more. Tf-Serving has many more features which we haven't discussed - Model Hot Loading, Versioning and host of different knobs to tweak your model performance.
Conclusion
This article outlined our journey from traditional ML model deployments to leveraging production-ready systems. We began by identifying critical shortcomings in our previous setup—low CPU utilization, high memory consumption, and an inconsistent, often subpar, latency profile. To address these challenges, we delved into their root causes for a deeper understanding. And finally introduced Tensorflow Serving.
While TensorFlow Serving (and TorchServe) are not new technologies, they remain surprisingly underutilized and overlooked in mainstream deployment processes. By integrating TensorFlow Serving into our stack, we introduced both a recommended pattern and an anti-pattern.
The outcomes exceeded expectations, delivering substantial performance improvements with minimal trade-offs. This experience highlights the transformative potential of adopting new technologies in the market.
As for this article, I hope you got to learn something new today.
Until next time! 👋🏼
